Due to a computational error, the data and conclusions in this post may not be accurate.
“Shattered” by Wade Rockett is licensed under CC BY-ND 2.0.
On September 2nd, King County Metro enacted its plan to suspend or reduce the frequency of 20 routes. Faced with a shortage of operators and mechanics, it could not reliably operate its existing service. Meanwhile, I proposed a reimagined transit network for Seattle, subject to the same service hour constraints. In contrast to Metro’s plan, it achieved greater access than Metro’s pre-reduction network. With schedules for the reduced service now available and running, it’s possible to analyze the exact access implications of the service reductions.
I calculated the 30-minute access in Seattle on September 21st, 23rd, and 24th: a weekday, Saturday, and Sunday. The future dates are chosen intentionally. Sound Transit’s Link 1-Line is currently running reduced service due to station work. Since the access analyses prior to the reduction included an unimpaired 1-Line, it would be unfair to compare them. The overall change in access would overstate the impact of King County Metro’s bus service reductions. By these dates, the Link will be in the same condition as it was in the previous analysis, meaning that the change in access is solely the result of Metro’s actions.
As I stated when introducing my network restructure, it isn’t something that Metro could have implemented quickly to decisively mitigate a labor shortage. Their reductions, on the other hand, were. Having the reductions in place makes the restructure more relevant. Harm is being done by them; that can now be quantified. With the immediate crisis alleviated and the damage no longer hypothetical, the work towards an enduring repair can begin.
Checking an Assumption
First, I wanted to determine whether the budget of in-service hours that I allocated for my restructure matched the actual amount that Metro reduce service in Seattle. While Metro indicated that service hours would be cut by 3.8%, it did not state whether that reduction would be proportionate throughout its service area. I worked under the assumption that it would be. As my restructure was limited to Seattle, I set its service hour limit to be the prior amount of hours serving the city, reduced by the same 3.8%. If Metro was planning on reducing the amount of service in Seattle by more than the average, it wouldn’t be fair to position my restructure as an alternative to Metro’s plan. Before the new schedules were available, though, I could not ascertain this.
| Service Pattern | Service Time | Service Seconds |
|---|---|---|
| Reduced Weekday | 5646 hours, 48 minutes, 53 seconds | 20,328,533 |
| Reduced Saturday | 3831 hours, 35 minutes | 13,793,700 |
| Reduced Sunday | 3500 hours, 29 minutes, 15 seconds | 12,601,755 |
| Reduced Week | 128,038,120 | |
| Restructured Day | 5054 hours, 43 minutes, 27 seconds | 18,197,007 |
| Restructured Week | 127,379,049 |
The assumption of a proportional reduction was safe. The restructure uses 0.51% fewer service hours than Metro’s actual reduced schedule. That small surplus is important. When I determined the budget for the restructure, I neglected to consider that some of King County Metro’s service is nominally public, but contracted by local private schools for the primary use of their students. These service hours are not part of the pool that can be reallocated. The trips account for 219,000 seconds1 in Seattle over the course of a week, whereas the restructure leaves 659,071 seconds available. The existing school routes could run, unmodified, on top of the restructured network, with service hours to spare.
Undertaking any large-scale service restructure is challenging. Beyond that, there are reasons specific to my plan that would upend many assumptions that King County Metro makes about operating transit service. There are many potential stumbling blocks along the way to implementation. Determining that the restructure’s in-service hours are comparable to Metro’s present investment in Seattle removes a large one.
Assessing the Damage
I previously described Metro’s service reductions as “an approach that necessarily reduces the ability to access destinations via transit.” Without a schedule, it is not possible to predict the extent of the reduction. It would be exceedingly unlikely, but canceling a route could have no impact on the access. This would occur if every journey that included that route can also be made with a different sequence of steps in under 30 minutes. Lowering the frequency of a route is very likely to decrease access overall, but changing the times that vehicles are at stops could also introduce new connections with other trips. Running an access analysis of the reduced service is the only way to account for these possibilities.
| Weekday | Saturday | Sunday | |
|---|---|---|---|
| Prior | 0.1001 |
0.0941 |
0.0949 |
| Reduced | 0.0992 |
0.0937 |
0.0948 |
| Change | ↓0.899% |
↓0.425% |
↓0.105% |
The overall impact on access is not large. Even on weekdays, where the reduction is most acute, it does not reach one percent.
Looking at the average can hide information, though. The comparative access map disaggregates the access reduction spatially. Weekday service has large areas of reduced access in Lower Queen Anne and north Seattle. This is unsurprising given which routes have had frequency reduced. What is surprising is that areas around Link stations see increased access. The Link 1-Line’s frequency is unchanged, though the start times of trips have been adjusted slightly. When centering the access map on some of the improved sectors near Link stations (by clicking on them twice), the improvement seems to be coming from the immediate areas around other Link stations. This suggests that some Link trips are scheduled for less time, but a cursory examination of the schedules did not positively confirm this. Changes to Saturday service notably contain an access reduction along the Rainier Avenue corridor. On Sundays, the reduction more resembles a lighter version of the weekdays. Metro’s strategy of cutting routes, and slashing frequency on others, will inherently weaken transit in some areas disproportionately. The access map confirms that is certainly happening in this case. Riders in some parts of the city will feel more pain than an overall sub-one percent access reduction would suggest.
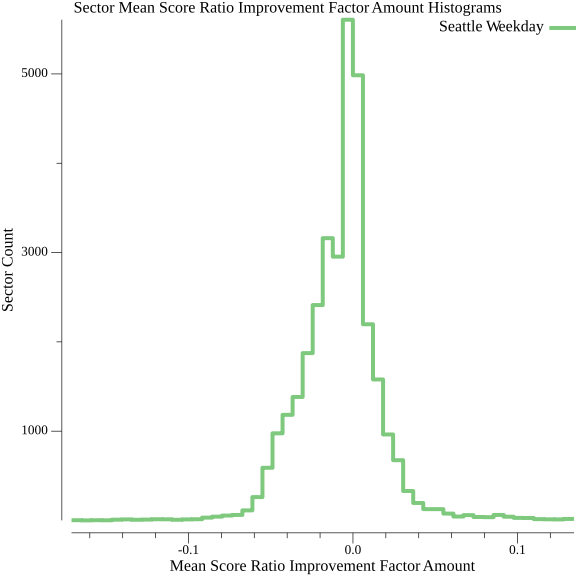
A 50-bin histogram of access reduction factor by sector offers a clearer view of the bound on the amount of reduction. Most locations in Seattle see minimal, if any reduction in transit access, but someone is losing over 16% of theirs. That could make a big difference in their ability to rely on King County Metro as a way to reach destinations throughout the city.
Moving Forward
Overall, I can’t find grave fault with King County Metro’s service reductions. They employ the blunt instruments of route cancelations and frequency reductions because those can be deployed expediently. From an access perspective, they don’t decimate the utility of the network, but they do cause measurable harm.
In the long run, it doesn’t have to be this way. What King County Metro did to mitigate its labor shortage isn’t bad, but it’s not good either. Decisive action in response to adversity should be followed by reflecting on what could have been done had a crisis not been imminent. Just restoring the prior service once open positions are filled would show an absence of reflection. The amount of in-service hours currently available to run transit in Seattle could be redeployed to build a better network. I hope that can be the legacy of this uneasy time for Metro and its riders.
-
I broke down the weekday transit service hours in Seattle by route, totaled the time for routes 987, 994, 988, 989, 982, 986, 984, and 981, and multiplied this by five weekdays. ↩︎